Inter-vertex distance
Contents
Inter-vertex distance#
This Jupyter Notebook demonstrates how to compute the inter-vertex distance for each template space and visualize them using the neuroboros package.
First we import all the packages that will be used.
import numpy as np
import neuroboros as nb
from scipy.interpolate import interp1d
import matplotlib.pyplot as plt
import matplotlib as mpl
import seaborn as sns
Customized colormap#
We used a customized colormap for our manuscript. Alternatively, you can use any Matplotlib colormap, for example, you can simply replace the block with cmap = 'bwr'.
nc = 10
colors = np.concatenate(
    [sns.color_palette("mako", nc)[1:],
     [[0.9, 0.9, 0.9]],
     sns.color_palette("rocket", nc)[1:][::-1]],
    axis=0)
cmap = mpl.colors.LinearSegmentedColormap.from_list('mako_rocket', colors)
Computing inter-vertex distance#
We computed the inter-vertex distance of each vertex as the average distance between the vertex and its neighbors.
The following code block computes the inter-vertex distance and stores them in ivd_dict, which is a dictionary.
ivd_dict = {}
for space in ['fsavg-ico32', 'fslr-ico32', 'onavg-ico32']:
    values = []
    for lr in 'lr':
        coords, faces = nb.geometry('midthickness', lr, space)
        surf = nb.surface.Surface(coords, faces)
        neighbors = surf.neighbors
        distances = nb.distances(lr, space)
        ivd = []
        for i, nbrs in enumerate(neighbors):
            ivd.append(distances[i, nbrs].mean())
        ivd = np.array(ivd)
        values.append(ivd)
    ivd_dict[space] = values
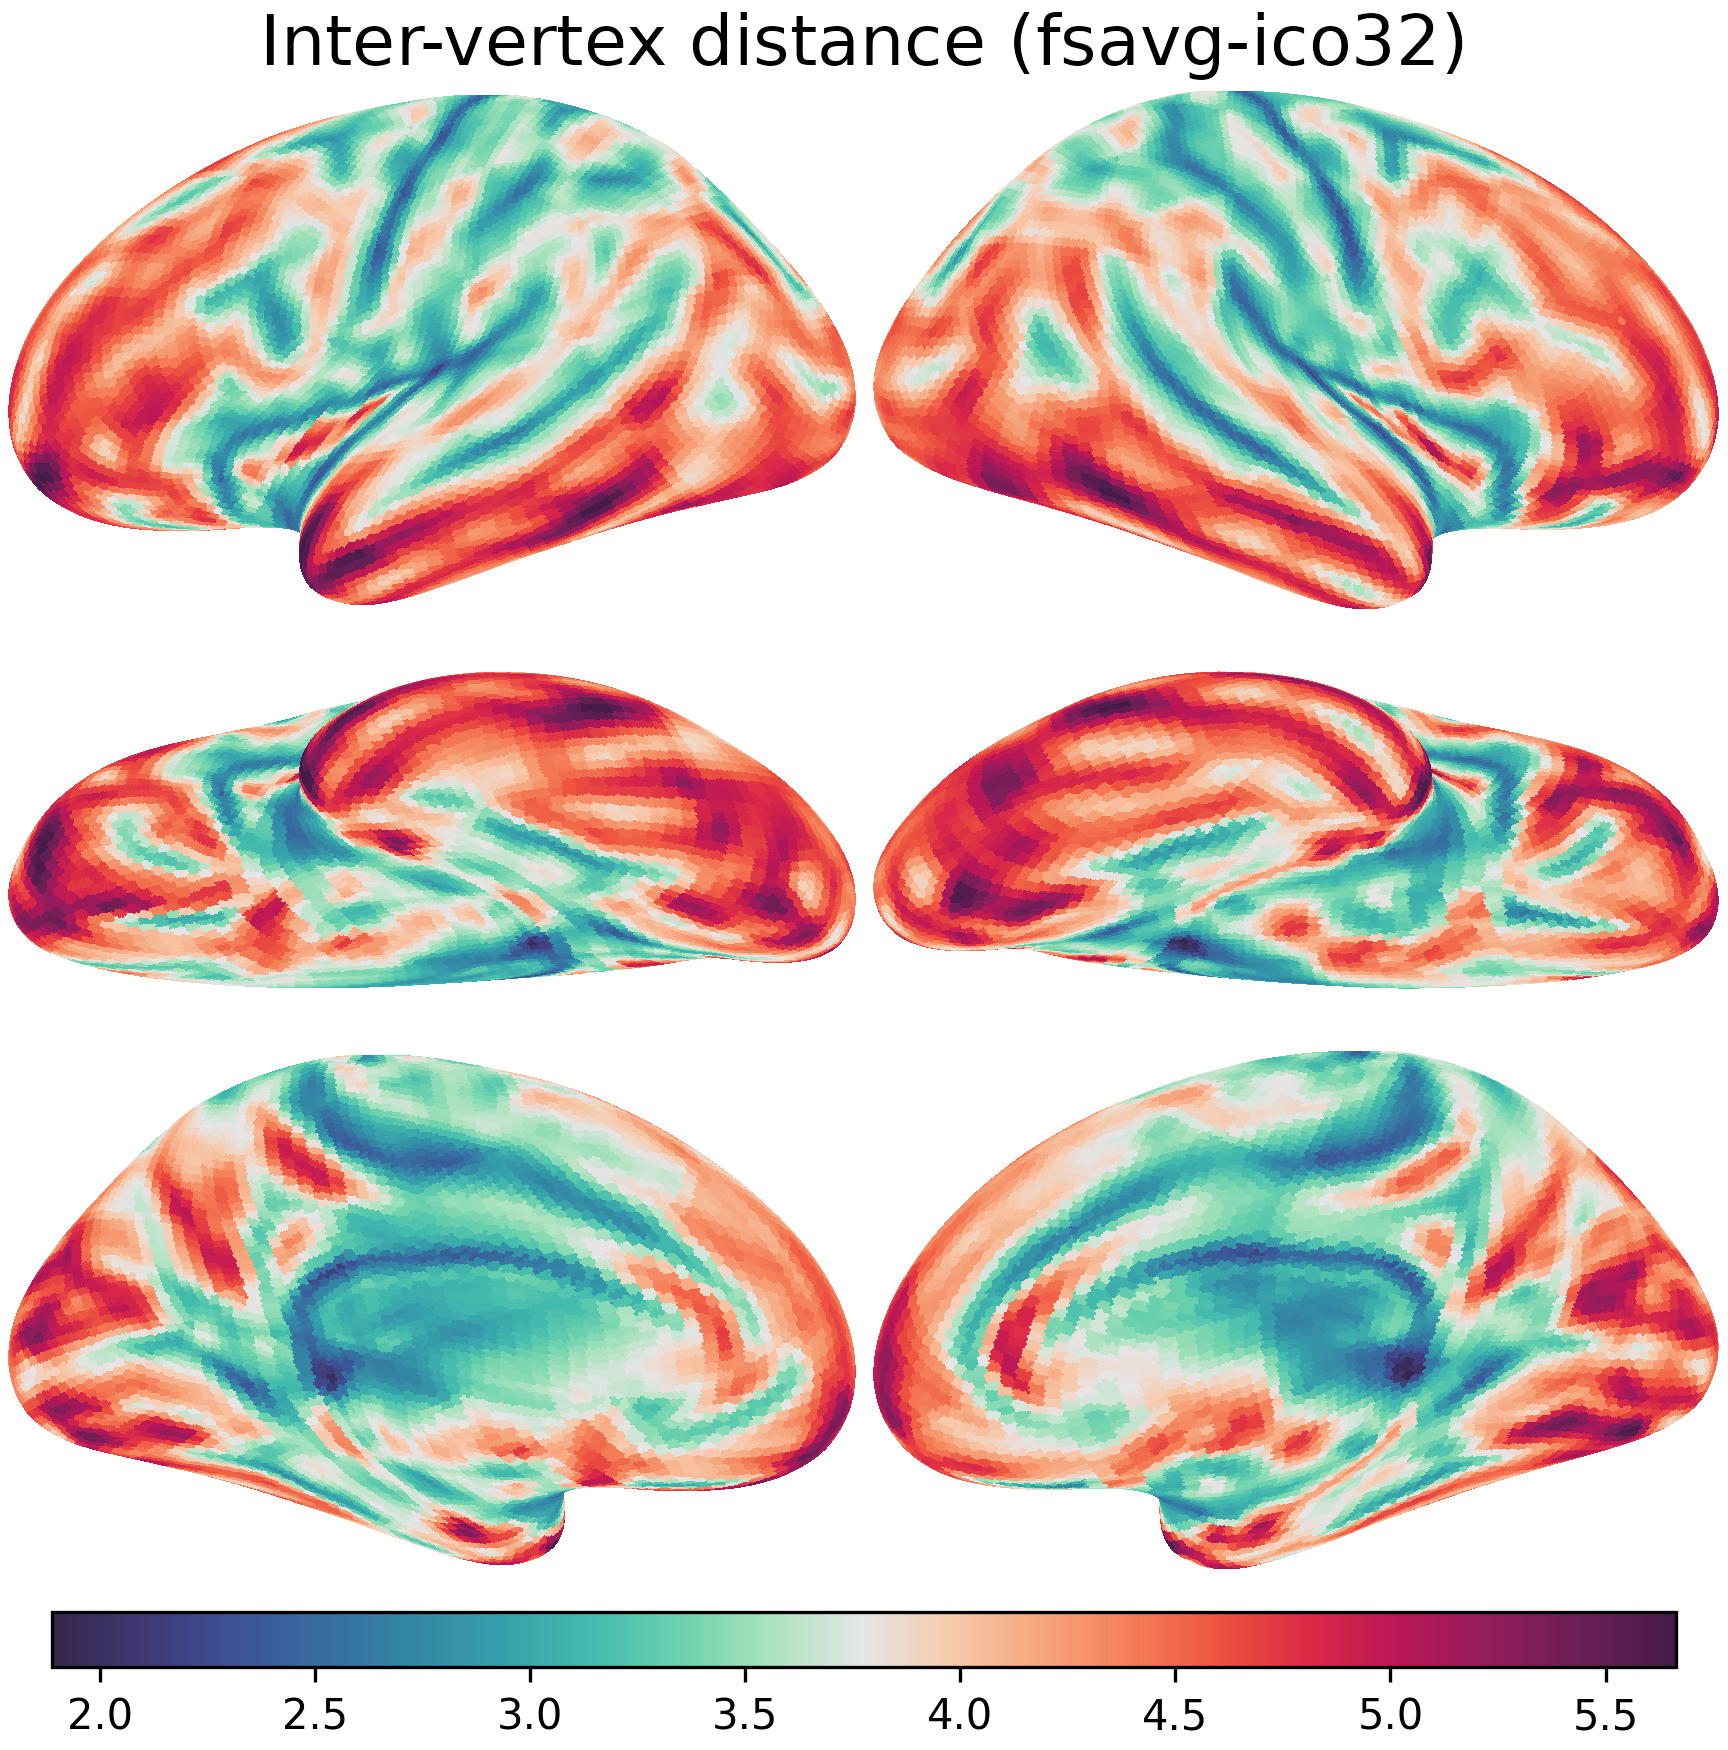
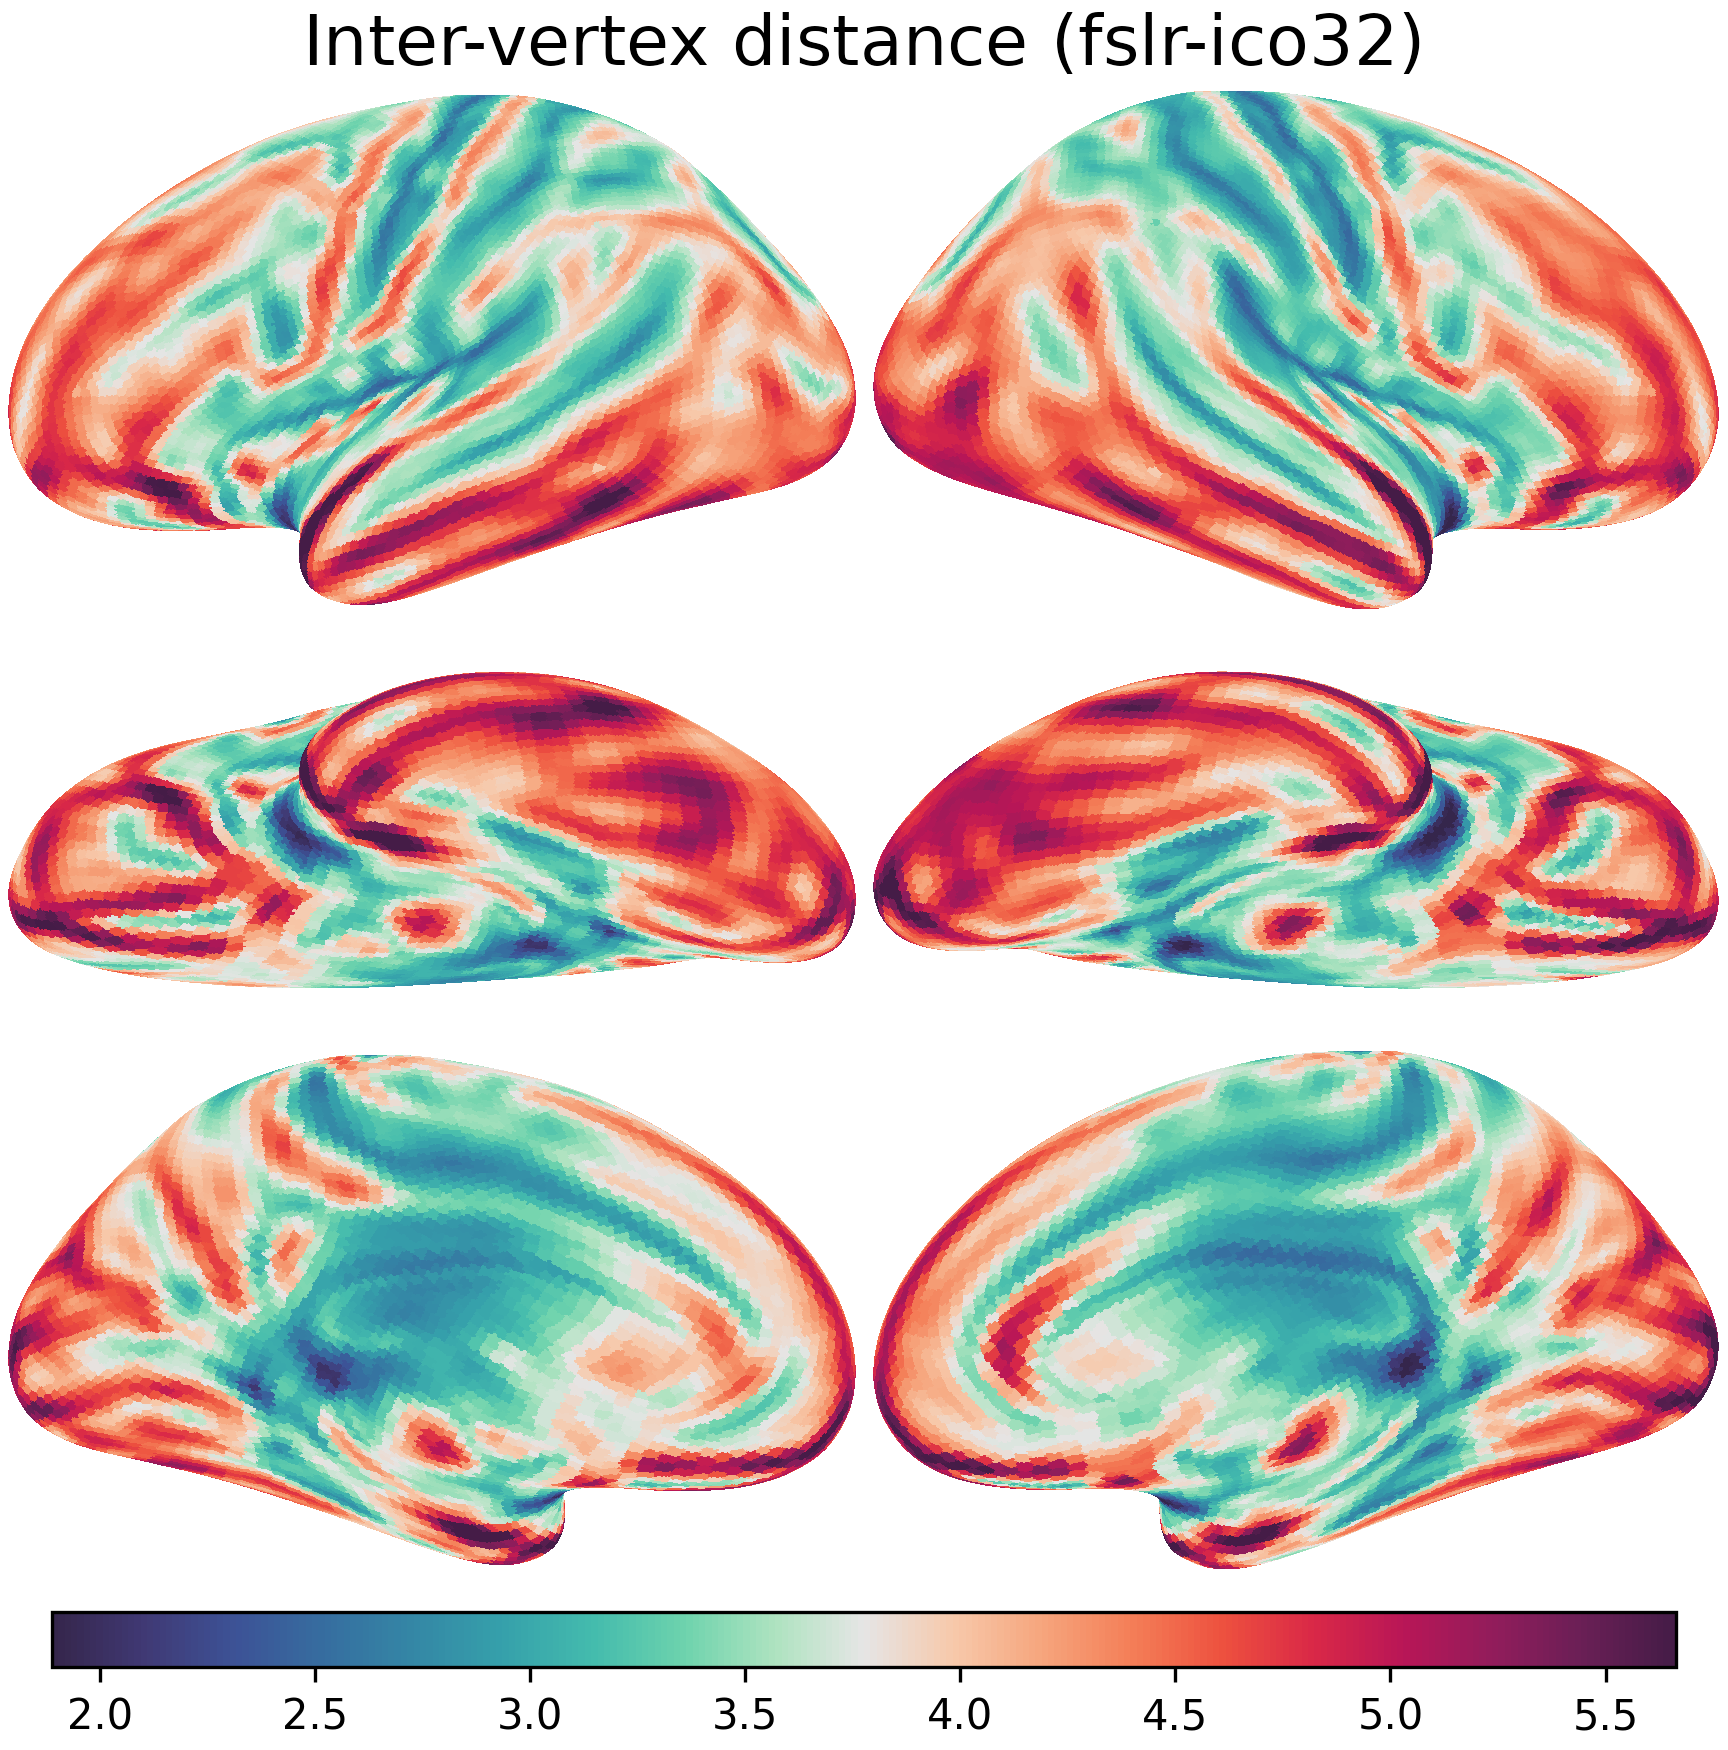
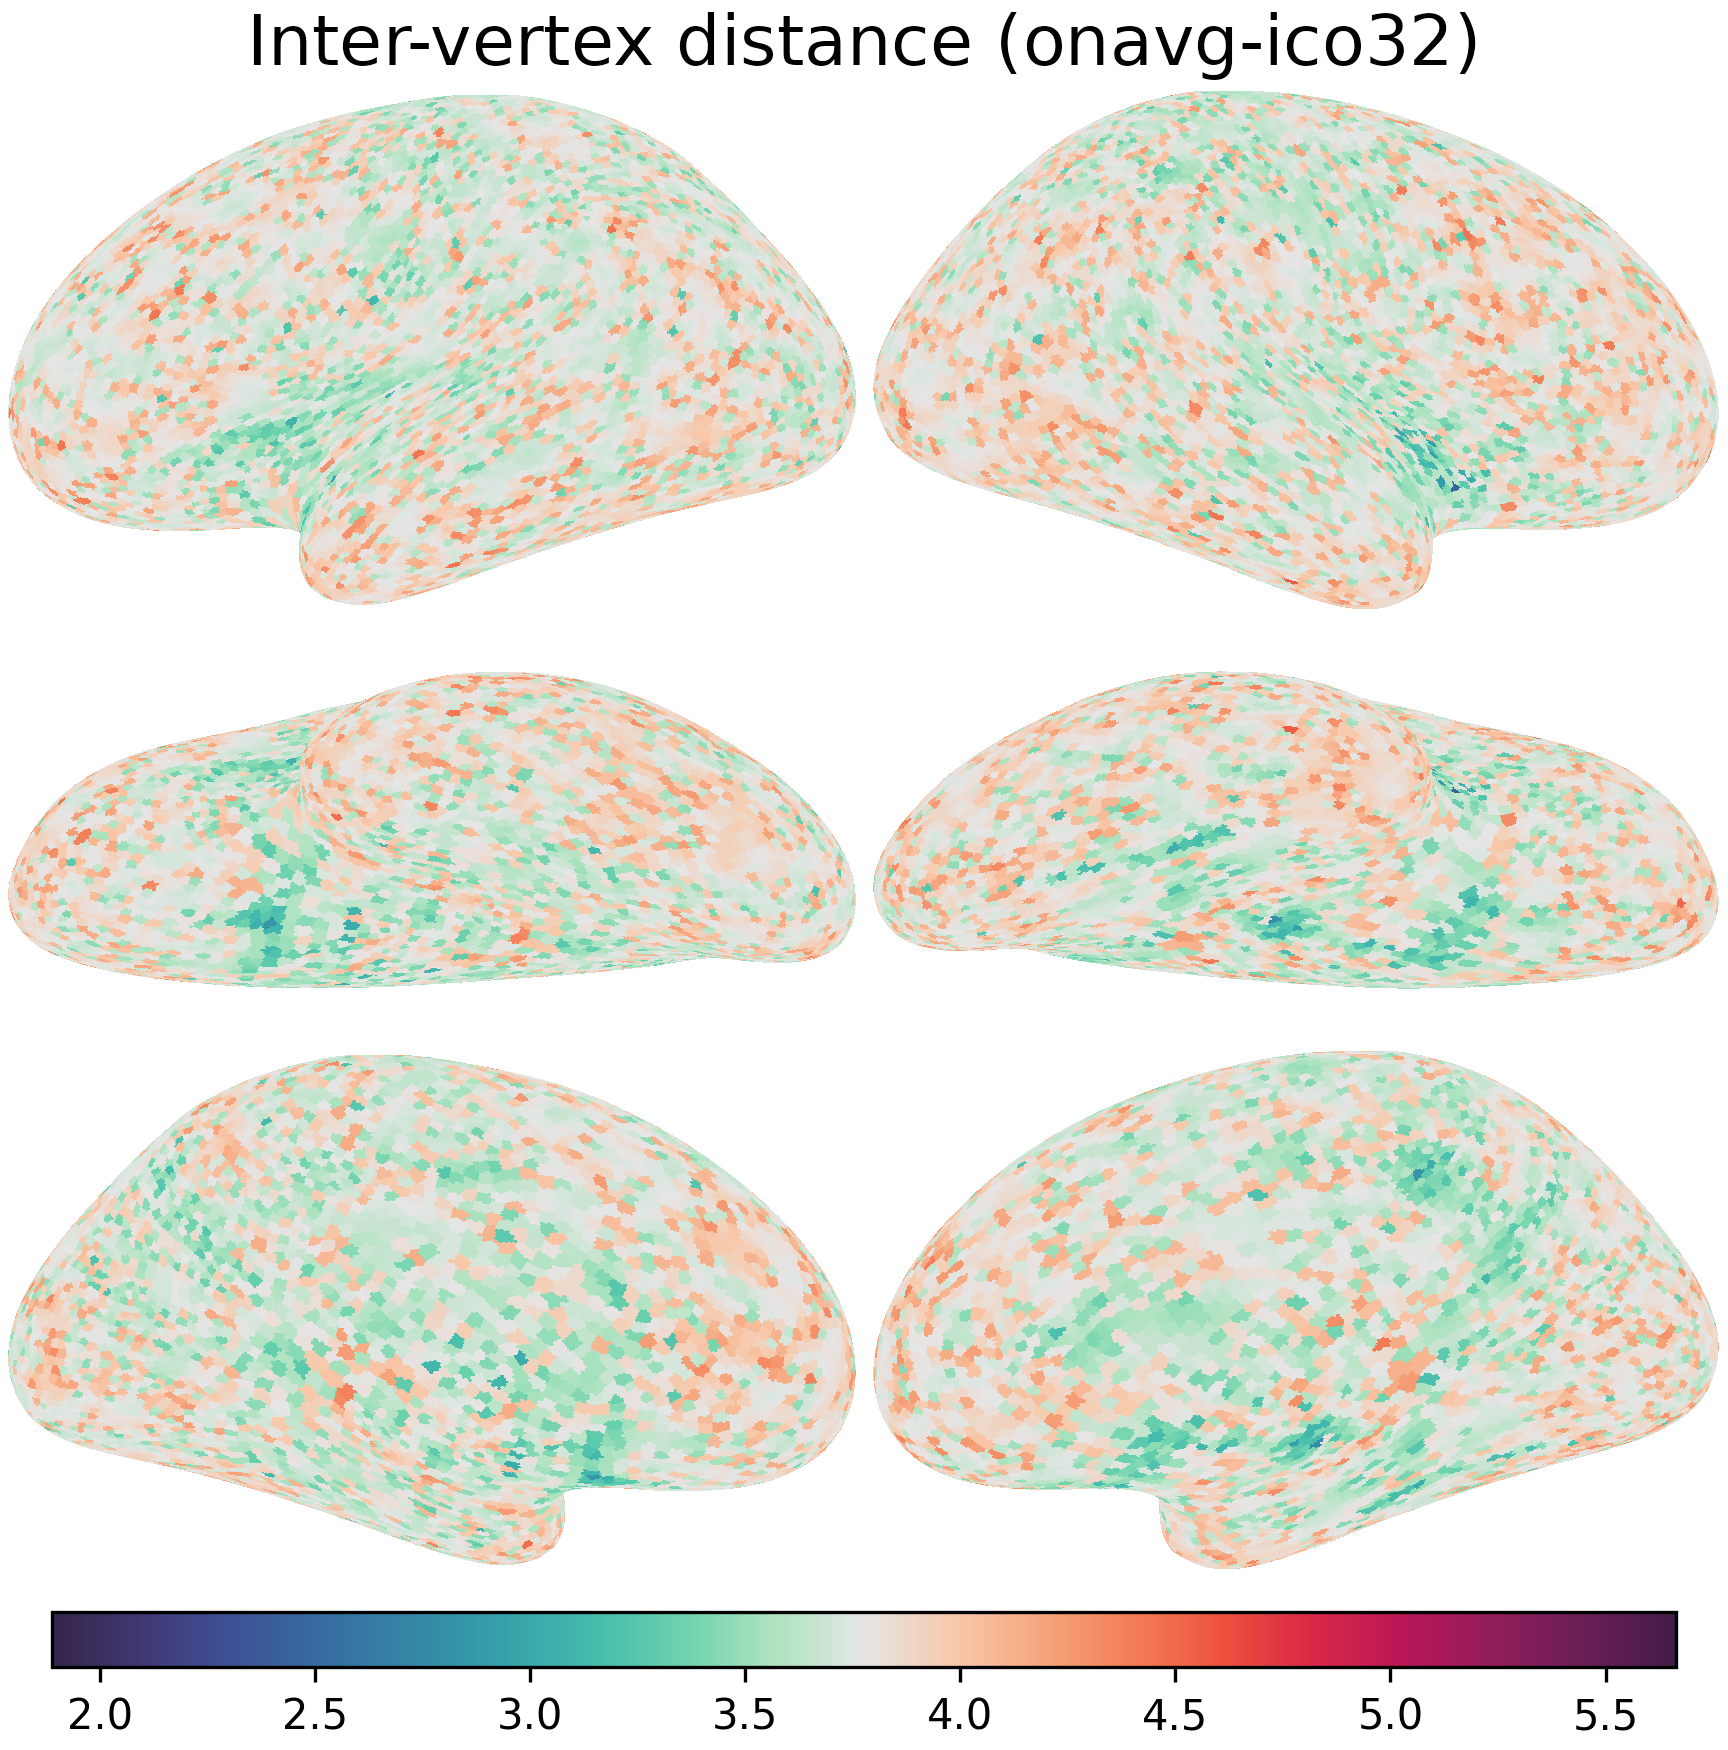
Visualization on cortical surface#
mean = np.concatenate(ivd_dict['onavg-ico32']).mean()
vmax, vmin = mean * 1.5, mean * 0.5
for space in ['fsavg-ico32', 'fslr-ico32', 'onavg-ico32']:
    values = ivd_dict[space]
    nb.plot(values, space=space, cmap=cmap, vmax=vmax, vmin=vmin,
            title=f'Inter-vertex distance ({space})', output='pillow',
            fn=f'figures/inter-vertex_distance_{space}.png')
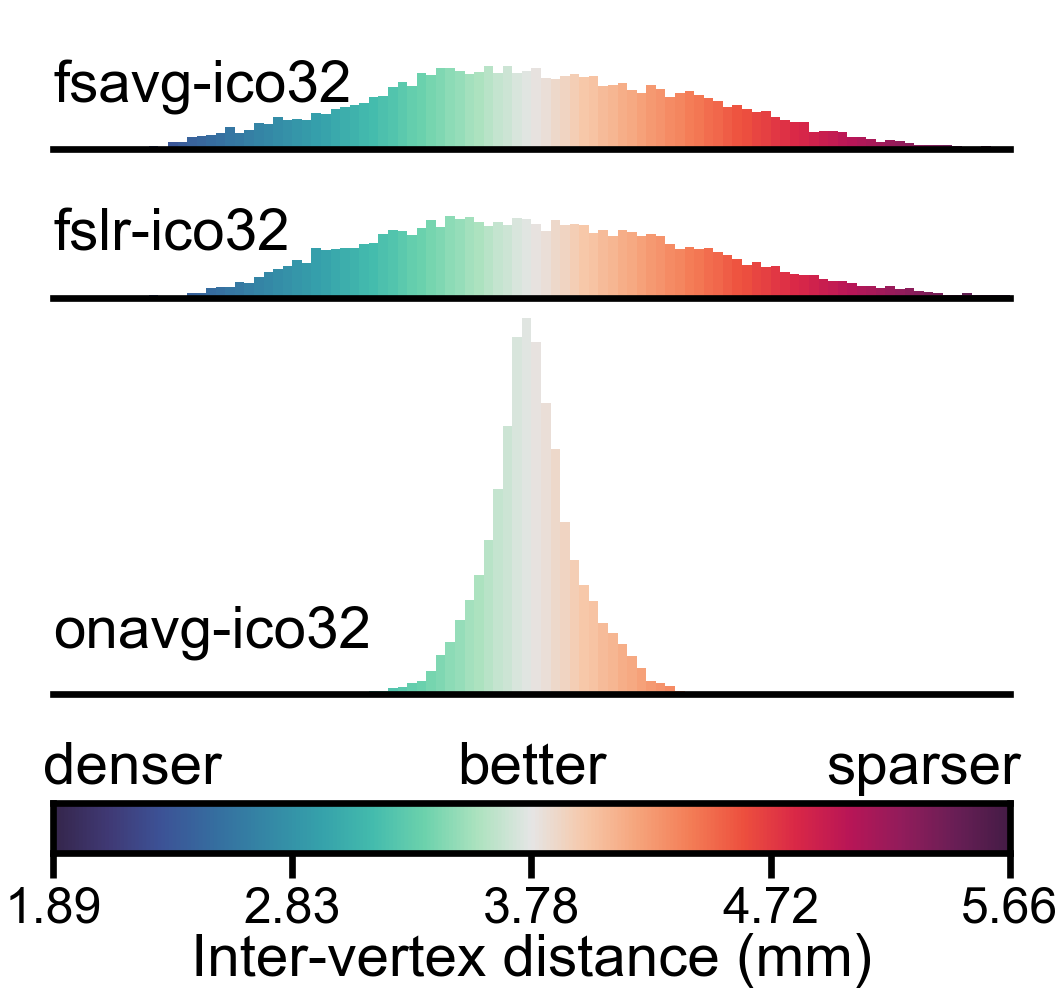
Distribution of inter-vertex distance#
The following block shows how to plot the histograms and the colorbar as in our manuscript.
ico = 32
mean = np.concatenate(ivd_dict[f'onavg-ico{ico}']).mean()
vmin, vmax = 0.5 * mean, 1.5 * mean
norm = mpl.colors.Normalize(vmin=vmin, vmax=vmax, clip=True)
lim = [vmin, vmax]
mpl.rcParams['font.family'] = 'Arial'
fig = plt.figure(figsize=(4.5/2.54, 4.2/2.54), dpi=600)

ticks = np.array([0, 0.25, 0.5, 0.75, 1]) * (vmax - vmin) + vmin

for i, space in enumerate([f'fsavg-ico{ico}', f'fslr-ico{ico}', f'onavg-ico{ico}']):
    y = [0.85, 0.7, 0.3][i]
    ax = fig.add_axes([0.05, y, 0.9, 0.2])
    d = np.concatenate(ivd_dict[space])
    bins = np.linspace(lim[0], lim[1], 101)
    for k in ['left', 'right', 'top']:
        ax.spines[k].set_visible(False)
    ax.set_yticks([])
    ax.set_xticks([])
    amplitudes, _, patches = ax.hist(
        d, bins, orientation='vertical', density=True, clip_on=False)
    for i, p in enumerate(patches):
        v = bins[[i, i+1]].mean()
        c = cmap(norm(v))
        p.set_facecolor(c)
    ax.set_xlim(lim)
    ax.set_ylim([0, {64:3, 32:1.5}[ico]])
    ax.set_facecolor([1.0, 1.0, 1.0, 0.0])
    ax.annotate(space, (0.05, y+0.09), xycoords='figure fraction', size=7,
               va='top', ha='left')

ax2 = fig.add_axes([0.05, 0.14, 0.9, 0.05])
v = np.linspace(vmin, vmax, 10001)
c = cmap(norm(v))

ax2.imshow(c[np.newaxis], extent=[0, 1, 0, 1])
ax2.set_xlim([0, 1])
ax2.set_ylim([0, 1])
ax2.set_yticks([])
ax2.set_xticks(interp1d(lim, [0, 1], axis=0)(ticks))
ax2.set_xticklabels([f'{_:.2f}' for _ in ticks], size=5)
ax2.set_xlabel('Inter-vertex distance (mm)', size=7, labelpad=0)
ax2.set_aspect('auto')
ax2.tick_params(axis='both', pad=1, length=3, labelsize=6)

annots = [(0.04, 'denser', 'left'), (0.5, 'better', 'center'),
          (0.96, 'sparser', 'right')]
for x, txt, ha in annots:
    ax2.annotate(txt, (x, 0.21), xycoords='figure fraction', size=7, ha=ha)

plt.savefig(f'figures/inter-vertex_distance_ico{ico}.png', dpi=600)
plt.close()
Now we have the statistical distributions and the color scale as the 4th panel: