Handle cortical masks
Contents
Handle cortical masks#
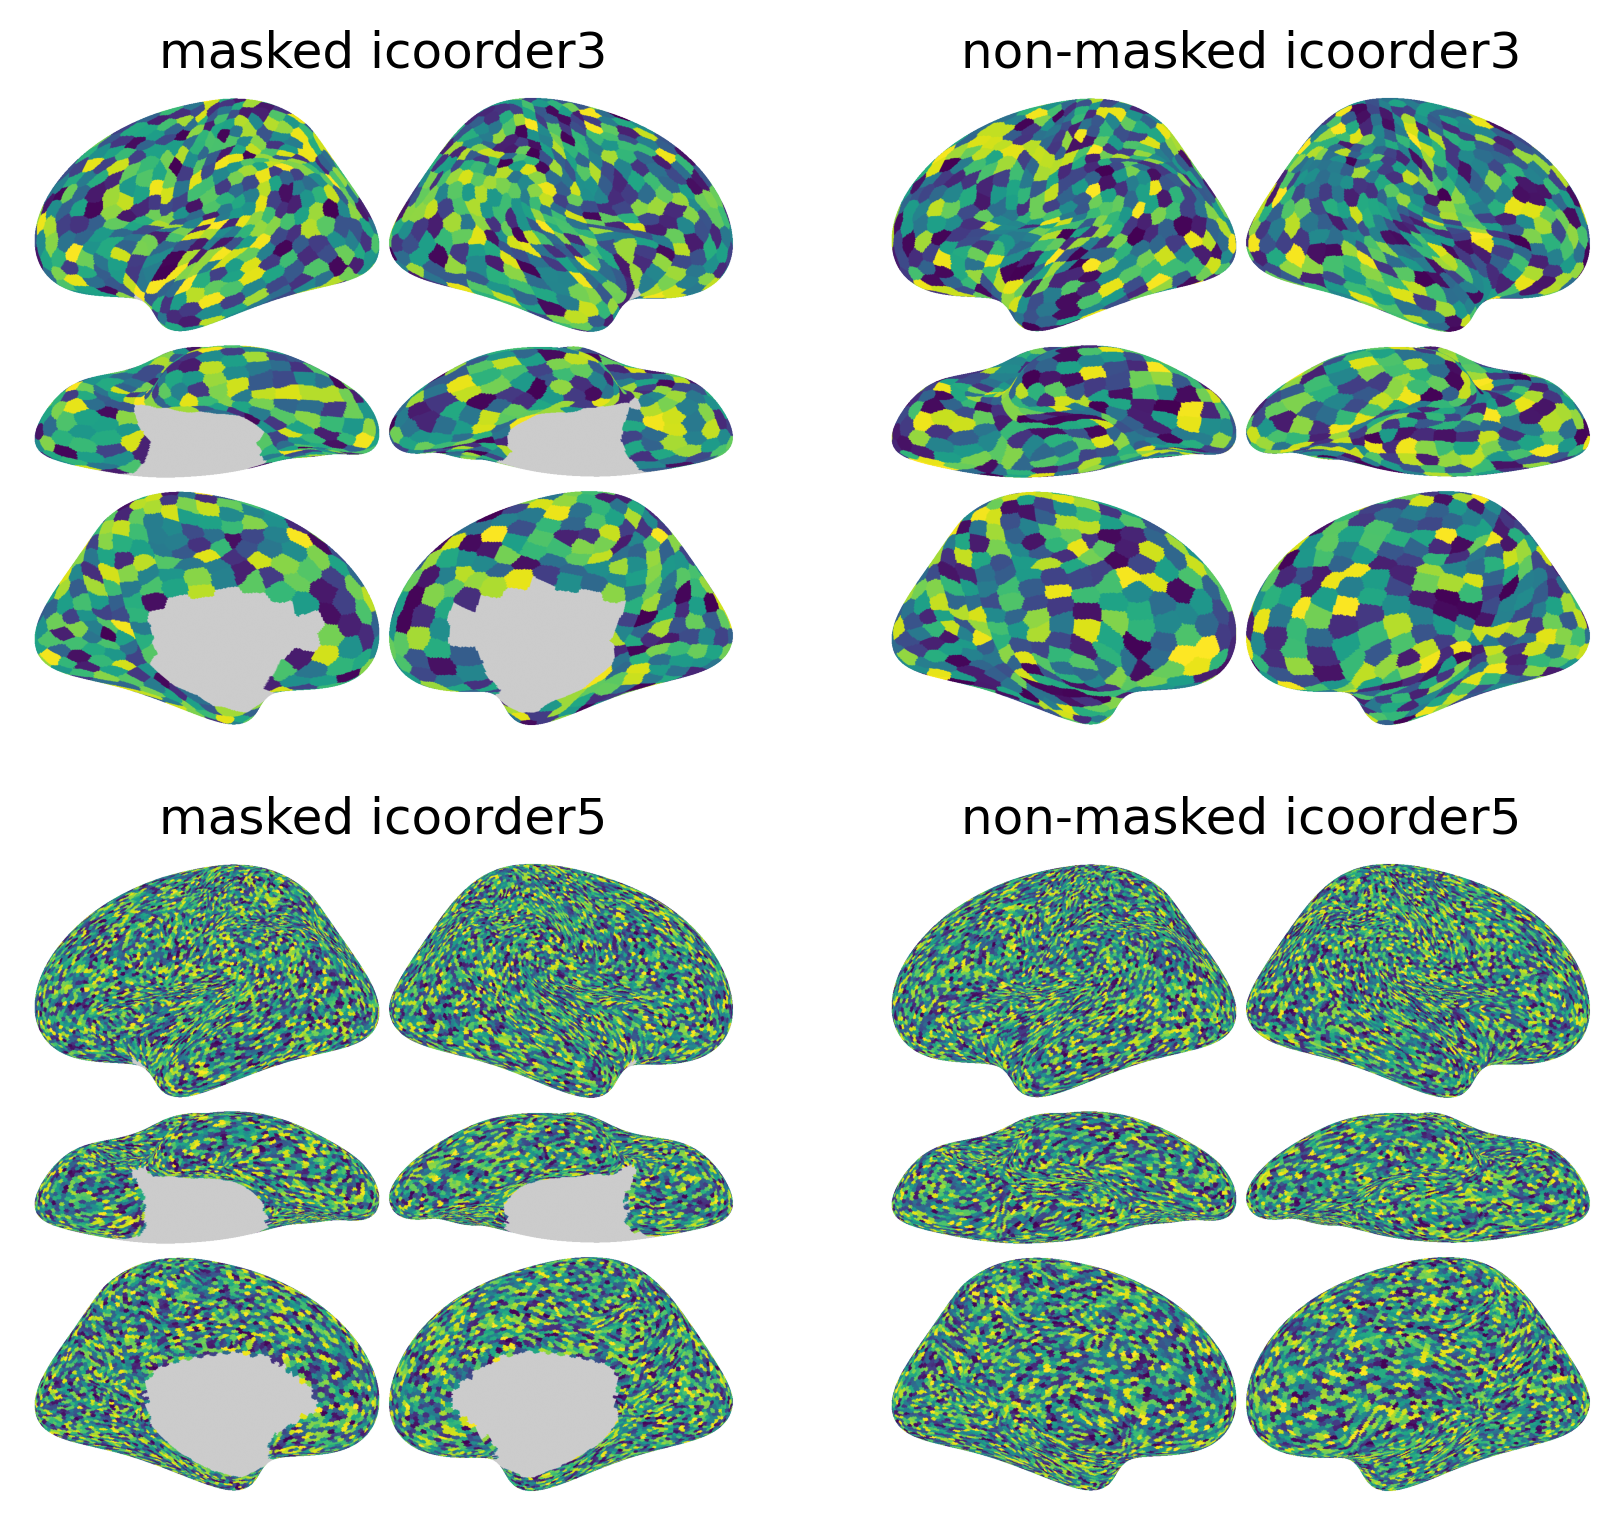
Not every vertex on surface belongs to the cerebral cortex. There are approximately 8.5% of vertices around the medial wall that are non-cortical. When analyzing fMRI data on surface, we usually want to focus on vertices of the cerebral cortex and mask out non-cortical vertices. This masking step changes the number of vertices and the shape of the data.
For example, with the icoorder5 resolution fsaverage surface there are 10242 vertices per hemisphere in total.
After masking out the non-cortical vertices, there are 9372 and 9370 vertices for the left and right hemispheres, respectively.
The brain_plot function automatically detects whether the data has been masked or not and render it accordingly.
import numpy as np
from brainplotlib import brain_plot
import matplotlib.pyplot as plt

rng = np.random.default_rng(0)
fig, axs = plt.subplots(2, 2, dpi=300, figsize=([_/300 + 1 for _ in [1728, 1560]]))
for i in range(2):
    for j in range(2):
        if (i, j) == (0, 0):
            v = rng.random((588 + 587, ))
            title = 'masked icoorder3'
        elif (i, j) == (0, 1):
            v = rng.random((642 * 2, ))
            title = 'non-masked icoorder3'
        elif (i, j) == (1, 0):
            v = rng.random((9372 + 9370, ))
            title = 'masked icoorder5'
        elif (i, j) == (1, 1):
            v = rng.random((10242 * 2, ))
            title = 'non-masked icoorder5'

        ax = axs[i][j]
        img = brain_plot(v, vmax=1, vmin=0)
        ax.imshow(img)
        ax.axis('off')
        ax.set_title(title)
plt.show()
Different forms of input#
The brain_plot function also handles different forms of input. The values to be plotted on surface can be one of:
Two NumPy arrays for the left and right hemispheres, respectively.
A list or tuple of NumPy arrays with two elements.
A concatenated NumPy array comprising data from both left and right hemispheres (left hemisphere first).
The same image can be generated using different forms of input, as long as the actual data is the same.
lh, rh = rng.random((588, )), rng.random((587, ))

img1 = brain_plot(lh, rh, vmax=1, vmin=0)
img2 = brain_plot([lh, rh], vmax=1, vmin=0)
img3 = brain_plot(np.concatenate([lh, rh], axis=0), vmax=1, vmin=0)

np.testing.assert_array_equal(img1, img2)
np.testing.assert_array_equal(img1, img3)